Bulk Chemical Price Index August 2026
Bulk chemical prices in August 2026 against a year earlier, across 59 chemicals bought by the tonne.
The dashed line is 2015 prices. 17% below the peak, 34% above 2015. In euros, prices were up 12% on a year earlier. Not adjusted for inflation.
Biggest moves in a year
35 of 59 chemicals cost more than in August 2025, 24 cost less. Each price is the 3 months to August 2026.
Up the most
-
Sulfuric AcidInorganic chemical
$0.40 per kilogram216% above 2015, when it was $0.13
+127% -
1,2-DichloroethaneOrganic chemical
$0.66 per kilogram69% above 2015, when it was $0.39
+95% -
Benzyl AlcoholOrganic chemical
$2.57 per kilogram39% above 2015, when it was $1.85
+55% -
Manganese DioxideInorganic chemical
$4.17 per kilogram101% above 2015, when it was $2.07
+55% -
CyclohexaneOrganic chemical
$1.38 per kilogram62% above 2015, when it was $0.85
+53%
Down the most
-
Calcium CarbonateInorganic chemical
$0.28 per kilogram188% above 2015, when it was $0.10
−28% -
Acetic AcidOrganic chemical
$0.47 per kilogram2.0% below 2015, when it was $0.48
−20% -
MentholOrganic chemical
$12.81 per kilogram18% below 2015, when it was $15.60
−20% -
BenzaldehydeOrganic chemical
$13.75 per kilogram143% above 2015, when it was $5.67
−18% -
Ammonium ChlorideInorganic chemical
$0.60 per kilogram68% above 2015, when it was $0.36
−17%
Organic and inorganic chemicals
The same index for each kind, 2015 = 100. Quote this
-
Organic chemicals31 chemicals
Index 117 in August 2026Up 16% on a year earlier
+16% -
Inorganic chemicals22 chemicals
Index 159 in August 2026Up 6.1% on a year earlier
+6.1%
Every chemical in the index (59)
A to Z. The change is the 3 months to August 2026 against the same 3 months a year earlier.
-
(+-)-MethionineCAS 59-51-8
$2.30 per kilogram56% below 2015, when it was $5.23
+48% -
1,2-DichloroethaneCAS 107-06-2
$0.66 per kilogram69% above 2015, when it was $0.39
+95% -
Acetic AcidCAS 64-19-7
$0.47 per kilogram2.0% below 2015, when it was $0.48
−20% -
Acetic AnhydrideCAS 108-24-7
$1.03 per kilogram32% above 2015, when it was $0.78
+4.2% -
AcetoneCAS 67-64-1
$1.14 per kilogram58% above 2015, when it was $0.73
+29% -
Aluminum HydroxideCAS 21645-51-2
$0.60 per kilogram54% above 2015, when it was $0.39
−6.0% -
Ammonium ChlorideCAS 12125-02-9
$0.60 per kilogram68% above 2015, when it was $0.36
−17% -
Ammonium SulfateCAS 7783-20-2
$0.29 per kilogram84% above 2015, when it was $0.16
+31% -
Barium CarbonateCAS 513-77-9
$0.74 per kilogram64% above 2015, when it was $0.45
+15% -
BenzaldehydeCAS 100-52-7
$13.75 per kilogram143% above 2015, when it was $5.67
−18% -
Benzyl AlcoholCAS 100-51-6
$2.57 per kilogram39% above 2015, when it was $1.85
+55% -
Butyl AcetateCAS 123-86-4
$1.32 per kilogram17% below 2015, when it was $1.59
+14% -
CaffeineCAS 58-08-2
$9.84 per kilogram9.2% below 2015, when it was $10.84
−1.3% -
CalciumCAS 7440-70-2
$2.90 per kilogram21% below 2015, when it was $3.67
−5.1% -
Calcium CarbonateCAS 471-34-1
$0.28 per kilogram188% above 2015, when it was $0.10
−28% -
Calcium ChlorideCAS 10043-52-4
$0.53 per kilogram6.4% below 2015, when it was $0.56
−8.0% -
Carbon DisulfideCAS 75-15-0
$1.23 per kilogram219% above 2015, when it was $0.39
+44% -
Chromium TrioxideCAS 1333-82-0
$3.20 per kilogram21% above 2015, when it was $2.64
−1.9% -
Citric AcidCAS 77-92-9
$0.91 per kilogram4.0% below 2015, when it was $0.95
+11% -
CyclohexaneCAS 110-82-7
$1.38 per kilogram62% above 2015, when it was $0.85
+53% -
D-FructoseCAS 57-48-7
$1.16 per kilogram32% above 2015, when it was $0.88
−10% -
DichloromethaneCAS 75-09-2
$1.18 per kilogram87% above 2015, when it was $0.63
−15% -
Diethyl EtherCAS 60-29-7
$3.61 per kilogram33% above 2015, when it was $2.73
−11% -
Ethyl AcetateCAS 141-78-6
$0.98 per kilogram17% above 2015, when it was $0.84
+9.5% -
Ethylene GlycolCAS 107-21-1
$0.73 per kilogram13% below 2015, when it was $0.84
+28% -
GlycerolCAS 56-81-5
$1.41 per kilogram65% above 2015, when it was $0.86
+34% -
HydroquinoneCAS 123-31-9
$4.74 per kilogram7.8% below 2015, when it was $5.14
−12% -
IodineCAS 7553-56-2
$67.65 per kilogram138% above 2015, when it was $28.43
+0.1% -
L-Tartaric AcidCAS 87-69-4
$2.26 per kilogram17% below 2015, when it was $2.71
−4.6% -
Lithium CarbonateCAS 554-13-2
$14.92 per kilogram190% above 2015, when it was $5.14
+35% -
Maleic AnhydrideCAS 108-31-6
$1.32 per kilogram7.8% above 2015, when it was $1.23
+34% -
Manganese DioxideCAS 1313-13-9
$4.17 per kilogram101% above 2015, when it was $2.07
+55% -
MentholCAS 1490-04-6
$12.81 per kilogram18% below 2015, when it was $15.60
−20% -
MethanolCAS 67-56-1
$0.52 per kilogram64% above 2015, when it was $0.31
+41% -
Methyl Isobutyl KetoneCAS 108-10-1
$1.43 per kilogram8.3% above 2015, when it was $1.32
−3.0% -
O-XyleneCAS 95-47-6
$1.41 per kilogram82% above 2015, when it was $0.77
+36% -
P-XyleneCAS 106-42-3
$1.26 per kilogram50% above 2015, when it was $0.84
+48% -
PhenolCAS 108-95-2
$1.43 per kilogram58% above 2015, when it was $0.91
+18% -
Phthalic AnhydrideCAS 85-44-9
$1.43 per kilogram60% above 2015, when it was $0.89
+24% -
Potassium CarbonateCAS 584-08-7
$1.29 per kilogram81% above 2015, when it was $0.71
−4.6% -
Potassium ChlorideCAS 7447-40-7
$0.45 per kilogram53% above 2015, when it was $0.29
+7.5% -
Potassium NitrateCAS 7757-79-1
$0.97 per kilogram24% above 2015, when it was $0.78
+9.8% -
Potassium PermanganateCAS 7722-64-7
$3.47 per kilogram42% above 2015, when it was $2.45
+4.4% -
Potassium SulfateCAS 7778-80-5
$0.67 per kilogram8.4% above 2015, when it was $0.62
+8.7% -
Propylene GlycolCAS 57-55-6
$1.57 per kilogram14% above 2015, when it was $1.38
+26% -
Propylene OxideCAS 75-56-9
$1.68 per kilogram23% above 2015, when it was $1.37
+15% -
ResorcinolCAS 108-46-3
$5.62 per kilogram3.4% below 2015, when it was $5.81
−0.3% -
SilicaCAS 7631-86-9
$1.44 per kilogram25% above 2015, when it was $1.15
−3.7% -
Sodium BicarbonateCAS 144-55-8
$0.38 per kilogram41% above 2015, when it was $0.27
−0.9% -
Sodium CarbonateCAS 497-19-8
$0.25 per kilogram24% above 2015, when it was $0.20
−9.3% -
Sodium ChlorateCAS 7775-09-9
$0.54 per kilogram6.6% above 2015, when it was $0.51
−16% -
Sodium DichromateCAS 10588-01-9
$1.55 per kilogram17% above 2015, when it was $1.32
−0.2% -
Sodium HydroxideCAS 1310-73-2
$0.86 per kilogram85% above 2015, when it was $0.47
+4.1% -
SucroseCAS 57-50-1
$0.67 per kilogram27% above 2015, when it was $0.53
−6.7% -
Sulfuric AcidCAS 7664-93-9
$0.40 per kilogram216% above 2015, when it was $0.13
+127% -
TetrahydrofuranCAS 109-99-9
$1.55 per kilogram37% below 2015, when it was $2.49
+24% -
TolueneCAS 108-88-3
$1.19 per kilogram70% above 2015, when it was $0.70
+44% -
UreaCAS 57-13-6
$0.54 per kilogram73% above 2015, when it was $0.31
+22% -
Zinc OxideCAS 1314-13-2
$2.86 per kilogram53% above 2015, when it was $1.87
+17%
Every year since 2002
| Year | In US dollars | In euros | Change |
|---|---|---|---|
| 2026January to August | 121 | 116 | |
| 2025 | 119 | 119 | −4.0% |
| 2024 | 123 | 127 | −8.0% |
| 2023 | 134 | 140 | −12% |
| 2022 | 153 | 162 | +35% |
| 2021 | 114 | 107 | +20% |
| 2020 | 94 | 94 | −7.9% |
| 2019 | 103 | 102 | −7.5% |
| 2018 | 111 | 105 | +14% |
| 2017 | 97 | 98 | +8.4% |
| 2016 | 90 | 91 | −10% |
| 2015 | 100 | 100 | −15% |
| 2014 | 117 | 98 | −4.5% |
| 2013 | 123 | 104 | −0.4% |
| 2012 | 123 | 107 | +0.1% |
| 2011 | 123 | 99 | +18% |
| 2010 | 104 | 87 | −0.2% |
| 2009 | 104 | 85 | −17% |
| 2008 | 125 | 95 | +24% |
| 2007 | 101 | 83 | +13% |
| 2006 | 90 | 81 | +8.9% |
| 2005 | 82 | 73 | +14% |
| 2004 | 72 | 66 | +11% |
| 2003 | 65 | 65 | |
| 2002March to December | 57 | 68 |
The average of each year's months, 2015 = 100. The change is the US dollar index against the year before.
Quote this indexReady sentences with the link in them, a chart and a reference
For your page
In August 2026, bulk chemical prices were 11% higher than a year earlier, by the Bulk Chemical Price Index of 59 chemicals (ChemicalSuppliers.com).
The Bulk Chemical Price Index stood at 134 in August 2026 (2015 = 100), 17% below the peak of 162 in September 2022 (ChemicalSuppliers.com).
In the year to August 2026, bulk prices of organic chemicals went up 16% and those of inorganic chemicals up 6.1% (ChemicalSuppliers.com).
Chart for your page
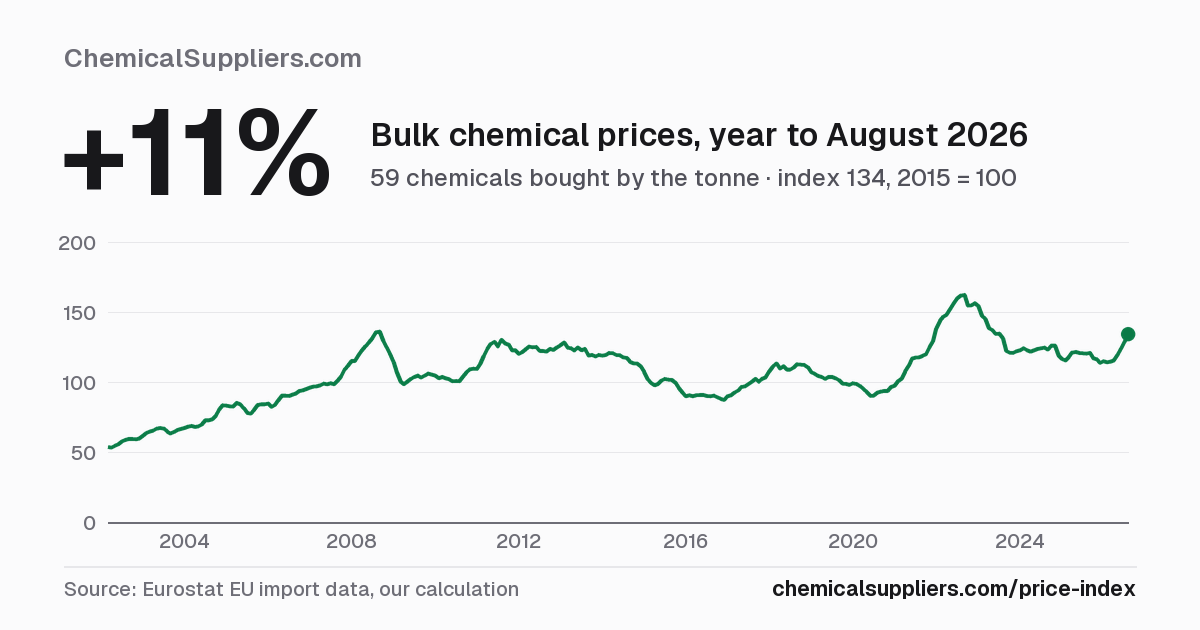
<a href="https://www.chemicalsuppliers.com/price-index/"><img src="https://www.chemicalsuppliers.com/price-index/price-index.png" alt="Chart: the Bulk Chemical Price Index, March 2002 to August 2026, 2015 = 100. It stood at 134 in August 2026, up 11% on a year earlier, after a peak of 162 in September 2022." width="1200" height="630"></a>
Every number on this page: download the data (CSV file)
Reference
APA, 7th edition
ChemicalSuppliers.com. (2026, November 3). Bulk Chemical Price Index. Retrieved November 6, 2026, from https://www.chemicalsuppliers.com/price-index/
ACS
Bulk Chemical Price Index. ChemicalSuppliers.com, November 3, 2026. https://www.chemicalsuppliers.com/price-index/ (accessed 2026-11-06).
BibTeX
@misc{chemicalsuppliers-price-index,
  author  = {{ChemicalSuppliers.com}},
  title   = {Bulk Chemical Price Index},
  year    = {2026},
  date    = {2026-11-03},
  url     = {https://www.chemicalsuppliers.com/price-index/},
  urldate = {2026-11-06},
  note    = {Figures to August 2026}
}Each line names the month it describes, so it stays true after the next update.
Questions
Are chemical prices going up?
Yes. In August 2026, bulk prices of the 59 chemicals in our index were 11% higher than a year earlier and up 4.4% on July 2026. 35 of the 59 chemicals cost more than a year before, 24 cost less.
How do chemical prices today compare with 2022?
The index peaked at 162 in September 2022 (2015 = 100). In August 2026 it stood at 134, 17% below the peak and 34% above 2015.
What is the Bulk Chemical Price Index?
A monthly measure of what buyers pay for 59 common chemicals bought by the tonne, such as citric acid, sodium hydroxide, urea and acetone. Each chemical's price is compared with its own 2015 average and the results are averaged, so 100 means 2015 prices and 150 means half as much again.
Where does the data come from?
Eurostat's records of every shipment into the European Union from outside it: the value paid and the weight, by trade code, each month. We divide value by weight and turn euros into US dollars at the European Central Bank's rate for each month. It is our calculation, not an official statistic.
How often is it updated?
Every month, as Eurostat publishes. Last updated November 3, 2026, with figures to August 2026. The next update is due around November 22, 2026.
Can I use these numbers?
Yes, free, including in articles, reports and commercial work. Please link to this page and credit Eurostat as the source of the trade data.
How we work it out
- Chemicals
- The 59 chemicals on our bulk prices page that also had a steady price in 2015. The same chemicals every month, so a move is a price move, never a change of list
- Prices
- What buyers in the European Union paid for imports from outside it: the value divided by the weight, over the 3 months ending each month, so one odd shipment cannot move it
- Each counts the same
- Each chemical's price is compared with its own 2015 average, and the index is the geometric average of those comparisons (a Jevons index). A cheap salt counts as much as a dear solvent. 2015 averages exactly 100
- Dollars and euros
- Each month's euros are turned into US dollars at that month's European Central Bank average. The euro index is in the download, so a currency move can be told from a price move
- Left out for a month
- A chemical with under 15 tonnes over the 3 months, or a price more than 5 times above or below its 2015 average. A month shows only when 80% of the chemicals have a price
- Kinds
- Organic and inorganic chemicals follow the trade codes (chapters 29 and 28). Fertilizers and sugars count in the whole index only
- Inflation
- Not adjusted: these are the prices buyers paid at the time
- Updated
- Every month, as Eurostat adds one, about 2 months after it ends. Last updated November 3, 2026. Figures for September 2026 are due around November 22, 2026
- Source
- Our calculation from Eurostat's EU trade data (Comext) and European Central Bank exchange rates. Not an official statistic and not a quote
- Using these numbers
- Free, also for commercial work. Download every month (CSV file). Please link to this page and credit Eurostat